Washington, USA (BBN) - A new visualisation from NASA shows how carbon dioxide dances in the atmosphere.
The heat-trapping gas appears as winds of red, blue and yellow whisking around the planet, reports The New York Times.
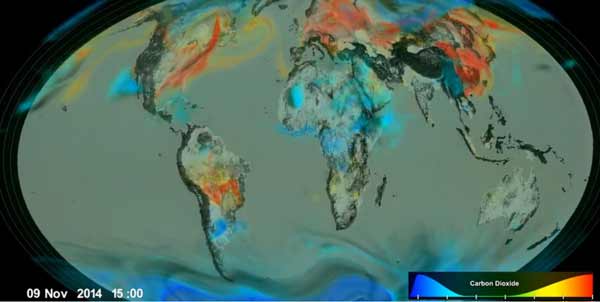
Each colour corresponds to a different concentration of carbon dioxide, with red representing the highest levels and blue the lowest.
The simulation, which was released on Tuesday, reveals the invisible drivers of climate change in three dimensions.
A large amount of carbon dioxide in the atmosphere comes from burning fossil fuels, and its concentration fluctuates as the seasons change.
NASA created the mesmerising simulation using a supercomputer using atmospheric measurements from the agency’s Orbiting Carbon Observatory-2 satellite. The OCO-2 satellite captures more than 100,000 carbon dioxide estimates from around the globe each day.
Here, the data depicts a year in Earth’s carbon cycle, beginning Sept. 1, 2014 and ending Aug. 31, 2015. The year 2015 was the hottest year on record. (2016 is on track to be even warmer.)
Carbon dioxide accumulates in the atmosphere during autumn and winter in the Northern Hemisphere. Trees shed their leaves during this time, which diminishes their ability to absorb the CO2.
In the visualization, half of the world looks as if it is engulfed in a thick red and orange fog.
During spring and summer, trees with freshly grown leaves remove carbon dioxide through photosynthesis.
In the simulation, the greenhouse gas changes to yellow and then blue.
But not all of the carbon dioxide gets sucked up, and the leftovers continue to contribute to global warming.
BBN/MS/ANS