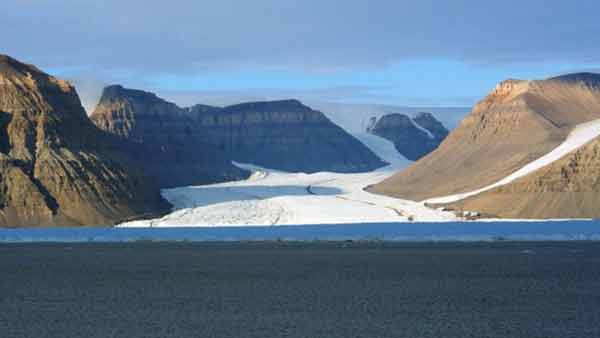
Ice drains from the Greenland down deep narrow fjords. This photo is taken from BBC.
Nuuk, Greenland (BBN) - Scientists have produced a stunning visualisation of Greenland – without its ice cover.
It is made from decades of survey data that show the position and shape of the territory’s bedrock, and the surrounding seafloor, reports BBC.
This is critical information needed to understand how the huge island might respond to a warming world.
Were all the ice on Greenland to melt, it would raise global sea-levels by 7.42m (24.34ft).
This is one of the refined statistics to come out of the new compilation of data.
It is a simple calculation: if you know the elevation of the top of the ice sheet and you subtract from that the height of the bedrock - you get a volume: 2.9 million cubic km.
"It gives us seven cm more of sea-level potential - a little bit more than we thought, but not a whole lot more," explained Dr Mathieu Morlighem from the University of California at Irvine, US.
"And the reason for that is that although we do find deeper fjords and deeper valleys, they're very narrow and constrained along the sides of the ice sheet. The interior hasn't change a lot, however."
Greenland is currently losing about 260 billion tonnes of ice to the ocean every year. It sounds a lot - and it is, but no-one is expecting an immediate collapse - not for centuries, at least.
Nonetheless, some of the answers as to how fast changes may come will be in this map's data.
"If you're trying to model an ice sheet, the single most important input is ice thickness," said Prof Jonathan Bamber. "Why's that? Because velocity is proportional to the fourth power of thickness. So differences in thickness make for huge differences in the velocity of the ice in our models; and to things like thermodynamics, because thick ice is warmer than thin ice, and so on," the Bristol University, UK, glaciologist told BBC News.
The colourful map is being distributed here at the Fall Meeting of the American Geophysical Union (AGU), the largest annual gathering of Earth and planetary scientists.
It is a dramatic rendering of an initiative called BedMachine which has sought to pull together everything we know about what lies under and around the giant ice sheet.
Scientists working on this project published a summary of their findings in a paper in Geophysical Research Letters last month, and now the British Antarctic Survey's (BAS) mapping department, at the request of Prof Bamber, has put the data in a visually understandable form.
Interesting features to peruse include the channelled terrain feeding the mighty Jakobshavn Glacier in the west.
Jakobshavn spews countless icebergs into the North Atlantic, and is responsible for draining 6.5% of the ice sheet.
Look at the spine of Greenland and you will see the mega-canyon that runs northwards towards another of the territory's big iceberg exporters - Petermann Glacier.
In studying the hidden landscape, scientists are now pretty confident that both ice streams sit on top of valley systems that were cut by rivers that flowed across Greenland long before there was an ice sheet. And it is clear also that meltwater continues to run down these valleys, under the glaciers, lubricating their flow.
The data for the map comes from three principal sources - from airborne radar that is able to penetrate the ice sheet to see the shape of the bed below; from ships surveying offshore, using sonar to map sea-bottom depths; and then there is a degree of modelling in some of the hard-to-reach places in fjords, explains BAS map-maker Dr Peter Fretwell.
"Around the coast it can be very difficult to get radio echo soundings (radar) because the surface is often crevassed and the radio waves won't penetrate through that. So in some fjords and bays, modelling is used, based on the speed of the glaciers. From their speed, you can estimate their thickness," he said.
Wherever possible, though, scientists have endeavoured to get up the fjords to acquire direct data.
This has been the imperative of the US-led OMG (Oceans Melting Greenland) project that is surveying large sections of the coastline.
OMG is finding that many of the glaciers terminating in fjords are so thick they are at risk of melting from the intrusion of warm ocean water at depth.
Dr Kelly Hogan, a BAS co-author on the BedMachine paper, found a similar picture when she joined an expedition to study Petermann.
"Most of the losses for Petermann Glacier, for sure, about 80%, are the result of warm ocean water getting under the glacier and melting it from below - not from iceberg calving," she said. "But if you get increased melting from below, you can get big channels forming on the underside of the floating front of the glacier and this can lead to thinning and fracturing that then make the glacier potentially more predisposed to breaking up."
Prof Bamber cautions, however, that there is a lot of complexity bound up in the new map.
Some of the mouths to the deep fjords, he says, have tall ridges, or sills, that act as barriers to the invasion of warm bottom-water.
"What we're starting to understand is that adjacent marine-terminating glaciers that are experiencing the same changes in forcing - in other words, the same changes in the ocean - can respond in very different ways, depending on the geometry of the fjord in which they lie.
"So, the better we can constrain these geometries, the better we will be able to model the interaction between the ice sheet and the ocean. At AGU, there are lots of sessions on this interaction. It's kind of the big thing at the moment," the Bristol scientist told BBC News.
BBN/SS/ANS